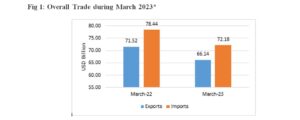
India’s overall exports (Merchandise and Services combined) in March 2023, is estimated to be USD 66.14 Billion, exhibiting a negative growth of (-) 7.53 % over March 2022. Overall imports in March 2023, is estimated to be USD 72.18 Billion, exhibiting a negative growth of (-) 7.98 % over March 2022.
Merchandise exports have registered highest ever annual exports of USD 447.46 billion with 6.03% growth during FY 2022-23 surpassing the previous year (FY 2021-22) record exports of USD 422.00 billion.
Services export lead the overall exports growth and projected to set a new record annual value of USD 322.72 billion with growth rate at 26.79% during FY 2022-23 over FY 2021-22.
- The growth is estimated to be 13.84% over FY 2021-22 (April-March). As India’s domestic demand has remained steady amidst the global slump, overall imports in FY 2022-23 (April-March) is estimated to exhibit a growth of 17.38% over FY 2021-22 (April-March).
MERCHANDISE TRADE
- Merchandise exports in March 2023 were USD 38.38 Billion, as compared to USD 44.57 Billion in March 2022.
- Merchandise imports in March 2023 were USD 58.11 Billion, as compared to USD 63.09 Billion in March 2022.

- In spite of strong global headwinds, India’s overall exports is projected to grow at 13.84% during FY 2022-23 (April-March) over FY 2021-22 (April-March).
- Under merchandise exports, 13 of the 30 key sectors exhibited positive growth in March 2023 as compared to same period last year (March 2022). These include Oil Meals (156.56%), Oil Seeds (99.5%), Electronic Goods (57.36%), Coffee (17.86%), Marine Products (12.85%), Fruits & Vegetables (11.37%), Rice (10.02%), Ceramic Products & Glassware (9.73%), Iron Ore (6.85%), Drugs & Pharmaceuticals (4.19%), Meat, Dairy & Poultry Products (3.44%), Tobacco (3.04%), and Cereal Preparations & Miscellaneous Processed Items (2.7%).
- Under merchandise exports, 17 of the 30 key sectors exhibited positive growth during FY 2022-23 (April-March) as compared to FY 2021-22 (April-March). These include Oil Meals (55.13%), Electronic Goods (50.52%), Petroleum Products (40.1%), Tobacco (31.37%), Oil Seeds (20.13%), Rice (15.22%), Cereal Preparations & Miscellaneous Processed Items (14.61%), Coffee (12.29%), Fruits & Vegetables (11.19%), Other Cereals (9.74%), Tea (8.85%), Leather & Leather Products (8.47%), Ceramic Products & Glassware (7.83%), Marine Products (3.93%), Drugs & Pharmaceuticals (3.25%), Organic & Inorganic Chemicals (3.23%) and RMG of all Textiles (1.1%).
- Exports of Electronic goods increased by 57.36% during March 2023 at USD 2.86 Billion as compared to USD 1.82 Billion in March 2022. During FY 2022-23 (April-March) electronic goods exports were recorded at USD 23.57 Billion as compared to USD 15.66 Billion during FY 2021-22 (April-March), registering a growth of 50.52%.
- Effect of duty withdrawal on Iron Ore is visible on India’s exports of the item which have exhibited positive growth of 6.85% during March 2023 over the same month in 2022.
- Textiles, Plastic & Linoleum exports continued to decline in March 2023 because of subdued demand due to recessionary effects in major economies.
- Under merchandise imports, 14 out of 30 key sectors exhibited negative growth in March 2023. These include Sulphur & Unroasted Iron Pyrites (-74.42%), Fertilisers, Crude & Manufactured (-50.98%), Silver (-43.64%), Coal, Coke & Briquettes, Etc. (-24.93%), Petroleum, Crude & Products (-23.79%), Vegetable Oil (-18.9%), Electronic Goods (-16.84%), Pearls, Precious & Semi-Precious Stones (-11.92%), Dyeing/Tanning/Colouring Materials (-11.56%), Cotton Raw & Waste (-11.31%), Medicinal & Pharmaceutical Products (-10.91%), Leather & Leather Products (-10.56%), Organic & Inorganic Chemicals (-5.07%) and Transport Equipment (-3.22%).
- Under merchandise imports, 6 of the 30 key sectors exhibited negative growth in FY 2022-23 (April-March) as compared to FY 2021-22 (April-March). These include Sulphur & Unroasted Iron Pyrites(-28.86%), Gold (-24.15%), Pulses (-12.79%), Medicinal & Pharmaceutical Products (-10.58%), Dyeing/Tanning/Colouring Materials. (-2.39%) and Pearls, Precious & Semi-Precious Stones (-0.99%).
- Silver imports slumped by 43.64 percent from USD 0.12 Billion in March 2022 to USD 0.07 Billion in March 2023.
- Merchandise exports growth for the period FY 2022-23 (April-March) remain impressive at 6.03% as against FY 2021-22 (April-March).
- China’s sharein India’s merchandise imports have declined to 79% in 2022-23 from 15.43% in 2021-22.
- Imports of electronic goods from China has seen a decline of around $2 billion in 2022-23 (Apr-Feb) compared to same period last year. Import share from China in electronic goods has also declined from 48.1% in 2021-22 (Apr-Feb) to 41.9% in 2022-23 (Apr-Feb). A significant fall in share from China seen in imports of fertilizers from 21.9% in 2021-22 (Apr-Feb) to 13.9% in 2022-23 (Apr-Feb) and this accounts for around half a billion fall in imports from China.
- Services exports remain strong and projected to grow at 26.79 percent during FY 2022-23 (April-March) over FY 2021-22 (April-March).
(Image courtesy: www.indiafilings.com)